发表于:2008-12-24 07:56只看该作者
2楼
同问~~~:P
发表于:2008-12-24 08:23只看该作者
3楼
你这个是什么平台啊
发表于:2008-12-24 08:26只看该作者
4楼
颜色可能是代表网速
发表于:2008-12-24 10:58只看该作者
5楼
你先要说清楚这是什么平台,在哪里有下载?别人才能实际的去测试,光看这么小一张图,要别人怎么帮你??
韬客社区www.talkfx.co
发表于:2008-12-24 12:02只看该作者
7楼
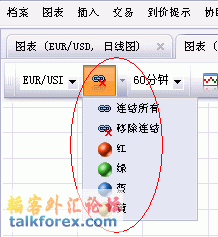
 - Link - link/unlink the chart. The button displays the current link of the chart.
The arrow opens a list. In the list the following commands are available:
[list][*]
 - link all charts together.[*]
 - unlink the chart.[*]
 - link the chart to the charts with the red link color.[*]
 - link the chart to the charts with the green link color.[*]
 - link the chart to the charts with the blue link color.[*]
 - link the chart to the charts with the yellow link color.[/list]
遇到矛盾 先站在对方的立场上想想问题,先试着去理解别人
● 如何使用WinMTR查询平台连接流畅度
发表于:2008-12-24 12:03只看该作者
8楼
协助 使用说明里有东西呀 嘿嘿 虽然是英文的.............
不过偶是看不明白... 你自己去帮助里面 最后一项下面看看 有点晕呵呵
[ 本帖最后由 老正 于 2008-12-24 20:08 编辑 ]
遇到矛盾 先站在对方的立场上想想问题,先试着去理解别人
● 如何使用WinMTR查询平台连接流畅度
9楼
字母分开来每个我能看明白,合起来我就不懂了:L
韬客社区www.talkfx.co
10楼
韬客社区www.talkfx.co
发表于:2008-12-24 12:18只看该作者
11楼
Chart Linking
Charts can be linked together. When charts are linked, you can change the instrument of these charts by changing the instrument of only one of the linked charts. This is useful when you use different periods for technical analysis, and want to change theinstrument you are working with.
All other settings such as period, time interval, chart type, etc. remain the same. Once you change the instrument in a linked chart, the whole MarketShots become shown on all of the linked charts. All indicators on these charts are recalculated, other chart elements (such as lines, Fibonacci, pivot levels and text labels) are removed.
You can link either all charts or only some of them.
To link all charts:
On the toolbar of any chart, click the Link arrow and then click LinkAll.
To link charts selectively:
On the toolbar of each chart you want to link, click the Link arrow and then click a color for the link (Red, Green, Blue or Yellow).
To unlink a chart:
On the toolbar of the chart, click the Link arrow and then click UnLink.
遇到矛盾 先站在对方的立场上想想问题,先试着去理解别人
● 如何使用WinMTR查询平台连接流畅度
发表于:2008-12-24 12:19只看该作者
12楼
图上不了... 拿机器翻译的也没看懂....呵呵
遇到矛盾 先站在对方的立场上想想问题,先试着去理解别人
● 如何使用WinMTR查询平台连接流畅度
发表于:2008-12-28 02:42只看该作者
13楼
这个连接功能类似excel的把各个分表组成群组的功能,对一个分表的操作,对所有群组分表同时有效。
当所有或者部分图表被连接之后,改变其中一个图表的分析工具,例如时间周期,均线,图表类型(K线,棒线等),所有被连接的图表跟着变。这样就不用你一个个地去改。但是有些东西就被自动拿掉了:画线,文字注解,百分比回调等。所以,有好有不好。它适用于用统一的方法来做分析。
具体连接的方法比较简单,看英文解释就可以了。
韬客社区www.talkfx.co
14楼
韬客社区www.talkfx.co



 无标题.GIF


