[名家专题]专题研讨(十四)经济数据对市场的影响及对应方法(上) ——如何看数据
有很多人,都认为数据跟消息一样,都只是檀花一现,不足为患,市场在数据过后,又会回复原来的轨迹…
我个人来说,同意一半,不同意又是一半…
何解?
原因是,消息跟经济数据,是两种不同的事物,影响深度也不尽相同——前者绝大部份都只是影响短暂,而且不会形成趋势,而后者却有较大机会成形趋势,什至影响到日后政府的施政方向…
消息跟经济数据最大的分别,莫过于数据可以预期,而且是定时定候的公布,消息则是突发性的,为分析带来更多的不确定因素…
在我们对数据行情加深认识以前,要清楚知道以上两者的分别,才能够作出「较有效力」的对应。
通常而言,经济数据的重要性在于对某国未来一段时间的经济预测以及目前的经济表现…
由于经济数据就是统计所得,表现形式上,跟我们所经常看到的各种货币的图表,是没有分别的(如果把数据图表化的话),所以,我们看经济数据,最重要的,还是要看趋势——这个理解,本质上,跟我们看图表所要求及寻找的答案,是没有本质上的分别的…
附录1,部份经济数据图表化之后的结果。
而趋势意识的应用,为我们预测未来,是大有婢益的… 因为我们(或市场参与者) 除了要从经济数据提供的讯息之中,获得了目前某国的经济状况的较准确的讯息以外,我们还能从趋势当中,找出对未来发展有用的讯息——当一个经济体的数据向上发展,就不太可能突然之间变差(向下) ,同理,如果经济大坏,也不可能突然变好… 所以,我个人认为,看数据跟看图表,没有本质上的区别——这是大出大多数人的意料之外的… 附录2,是部份经济数据(包括美国非农数据)的「半官方」解释,由于转录自美国CNN,暂时只能提供英文版本,如果大家有兴趣,可以试着翻译,并贴出来,以便做褔后来者。
每个单项,均是各国政府赖以制订经济政策的原料… 我现在就较重要的数据,作一个简单介绍… GDP(国民生产总值) 国民生产总值,是指固定时期内,国民能够产生的生产总价值,当中包括第一产业(农业及原材料生产,例如原油、木材等) 、第二产业(工厂生产的产品,包括所有工厂产品及建造业) 及第三产业(包括所有服业业,例如金融、销售等等) … 原则上,此数字越大,代表了一个国家的富强,数字越小,代表了一个国家的落后——由于各国的人口数字不同,目前经济学界有倾向使用「个人国民生商总值」作为一个社会的富强指针,所以,大家可以发觉,从总体国力出发,个别国家可以很强,但实际上,国民个人所得并不太高——最佳例子是中国。 我们现在一般看到的GDP,是指其增长数值,即增长百份比,各国政府也是按季度公布的——通常而言,如果出现连续三个季度的GDP负增长,将会被视为经济衰退——通常的巡环是五到七年增长,两年出现衰退。 由此而引伸出一个问题——国家经济调控政策,通常而言,由于现代经济发展较稳定,各国有关当局都深知道衰退的祸害,所以他们都会提前作出行动,以尽量的避免出现衰退时,对整个国民经济的打击——所以,大家可以看到,美国经济最好的时候,联储局开始加息,中国也在经济最好的时候进行宏观调控,其理在此。 对市场而言,GDP的增长,代表了一个国家的经济,也代表了一个国家的购买力,从而也会反映在汇率上,所以,GDP数值越大,对汇率的利好程度也越高。 此是教科书的标准答案,实际市场影响,后面会有所提及。 通货澎涨(Inflation) 目前,各国的通货澎胀指针,其内容都不尽相同,但基本上都以物价作为基准,然后就各自的国情作出参考指针的微调。 通常而言,我们所说的通胀,是指消费物价指数(CPI) ,并作为加减利息(调控政策) 的指针性数据,但也有些国家例外,例如美国,由于其服务业占国民经济很大部份,所以消费情绪的参考,也非常重要,这方面,有关当局会综合参考当时的就业情况,销售数字等,作为加减利息决定的参考。 通常而言,发展中国家和已发展国家,能够容忍的通胀幅度,是有所不同的… 在OECD(已发展国家组织) 的标准来说,最适通胀率是2%以下,而部份发展中国家,例如中国,因为经济发展的需要,反而不能够忍受这幺「低」的通胀率… 在这样的一种认知下,大家可以发觉,如果通胀率有迫近2%或超过2%的时候,其央行必定会实行加息,以压制通胀继续向上偏离「最适通胀数字。 当然,如果通胀数字接近0,那就是很接近通缩了,而低于0,那就是通缩… 通统如果持续一段较长时间,就会出现较大规模的经济衰退(请参考附录1)。 对市场而言,通胀高于2%,代表了央行会进行加息行动,自然会利好当地货币,而如果通缩出现,则因为有可能减息,自然的利淡当地货币。 就业数据(Employment Situation,含失业率及就业人数两部份) 我们一般非常重视的美国非农数据,其实是就业数据的一部份… 很多人想当然的以为,就业人数的增加,必定会出现失业率下降的结果… 其实这是完全错误的… 由于采集方式的不同,注定了失业率跟非农数据不会走在同一道上… 失业率,是由美国劳工部门根据报称失业人员及伸领失业救济金人员对整体就业人数的比率… 而新增职位(非农数据) 则是美国劳工部对各企业新增职位(例如在报刊上刊登招聘广告) 的调查所得,其中包括了所有的临时职位(这会造成特定环境下,新增职位急增的现像,例如去年十一月的美国大选,当时我就预测过非农职位会激增,原因是大选期间,新增了选区工作人员的临时职位,结果是新增职位创纪录性的录得超过30万的增长,又例如十二月和四月,因为是节假黄金消费期,临时职位都会大增)… 由于采样的不同,有时候会出现失业率上升,但新增职位同时上升的极端现像。 另一方面,前文已经提到过,因为美国的独特环境,就业数据,也是联储局决定利息的因素之一… 其中又以非农职位作为很重要的议息参考——大家应该明白,为何非农数据那幺重要了… 根据以往的经验,又或一些不成文的意见,非农职位如果连续三个月增加25万,联储局就会加息,相反,如果连续三个月负增长,美联储局就会减息… 事实上,我多次测中(或接近) 联储局加减息的时间,就是长期注意着非农数据的结果。 有关于其它经济数据,请参考附录2。 ----------------------------------------------------------------------------------------------------------------- 关于经济数据对市场的影响而言,通常有两种途径,一个是「预期心理」(Expectation),另一个是「震撼效果」(Shocking Effect) ,前者会出现「Pricing-in」(提前消化)现像,后者就会增加汇价的波动率和速度。 通常而言,每月的经济数据,都会提前一到两周公布预期——这些预期,都是各大通讯社对经济学家或业界做调查的结果,各通讯社间的结果可能不尽相同… 由于市场的占有率及调查方法,目前市场都默认路透通讯社(Reuters) 的预期中间数,作为预测数字的参考。 相信大家都知道,要在市场生存、赚钱,时间和信息的获取,是各方投资者所希望的,这种共同的期望,就做成了一些我们所谓的「提前消化」的现像… 问题是,为什幺不是每次数据公布前,都出现「提前消化」的现像呢? 这是因为,1、市场的焦点,2、数据重要性的次序,3、当时市场价格,是否因为前期的发展而出现了过份的价值上升或下跌,这些都是影响数据行情,会不会出现提前消化的现像。 举得例子,今年上半年,美元回升超过了11%,其中就包含了「提前消化」的现像,这是为什幺明天美国都几乎铁定加息了,直到今天,美元还不肯进一步上升的原因。 另一方面,大家都知道,做外汇的,都不是做单一货币,大家目前所做的外汇市场,其实是叫作「美汇」的,即是说,主要货币都跟美元做汇兑交易(或以美元作为报价参考) ,所以,当我们要看美元的走势时,也不得不个别因应各种货币国的经济发展,在此销彼长的经济表现下,也会影响到汇价的表现… 在做数据行情的时候,我们也要留心可能出现的提前消化现像所做成的「消息入市,证实平仓」的发展… 很多时侯,大家都会奇怪,为什幺明显是利好的数据,会出现利反的现像呢? 原因就是有市场的预期心理,造成了「提前消化」的现像,而实际数据的「市场价值」,又都已经反映在现价水平了,然后,市场就会因应情况,开始出现平仓现像——到底平仓量是多少,还要视乎市场对未来一段短时间的「预期心理」… 另一方面,数据价值——数据可能带来的波动幅度(这个可能是我自创的) ,到底是多少? 是100点,是200点,还是300点? 这要视乎提前消化的程度而定… 另一方面,如果事前未有出现明显的提前消化现像,则震撼效果(Shocking Effect) 就会起到明显的作用——真实数据跟预期值相差越大,震撼效果就越高!! 在这里,有两个重要的问题,一是我们如何确定有没有出现「提前消化效应」,二是我们如何确定数据价值? 我将在下期——实战部份作出相对应的解答。
2楼
附錄1
此圖表是我個人根據美國政府資料製作,大家可以參考,其實圖表化以後的經濟數據,跟我們看匯價圖表,並沒有兩樣,主題要看的,就是趨勢。
轉貼時請注明,謝謝…
[ 本帖最后由 leo 于 2005-8-8 17:33 编辑 ]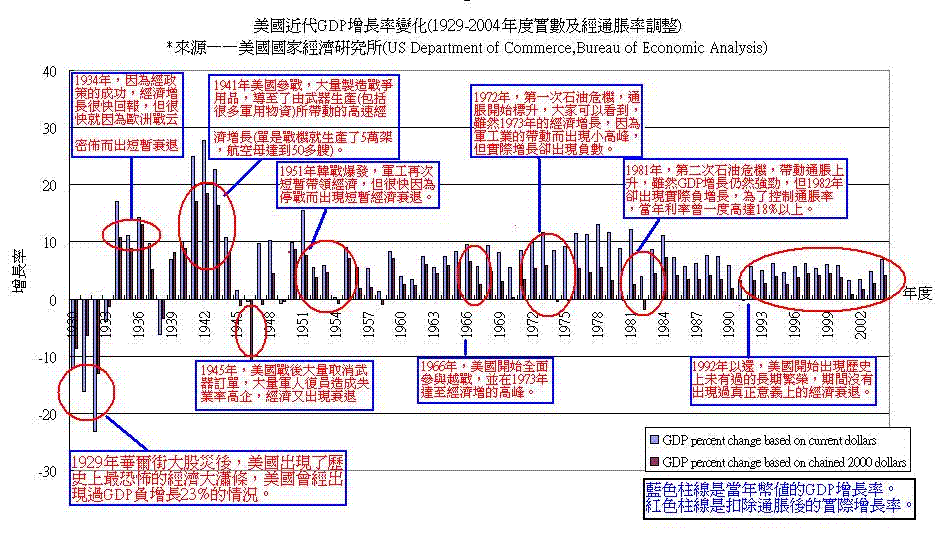 美國近代GDP增長圖.GIF
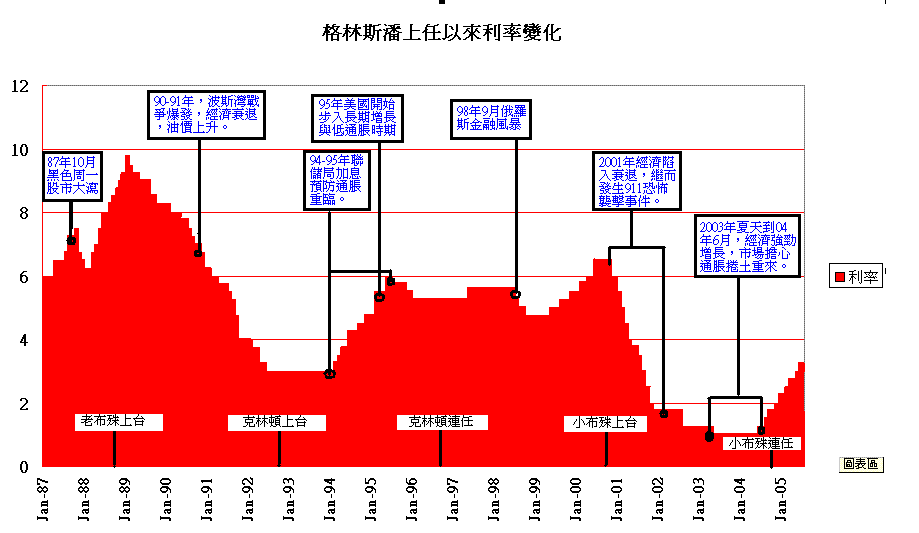 格林斯潘任內利息升跌.GIF
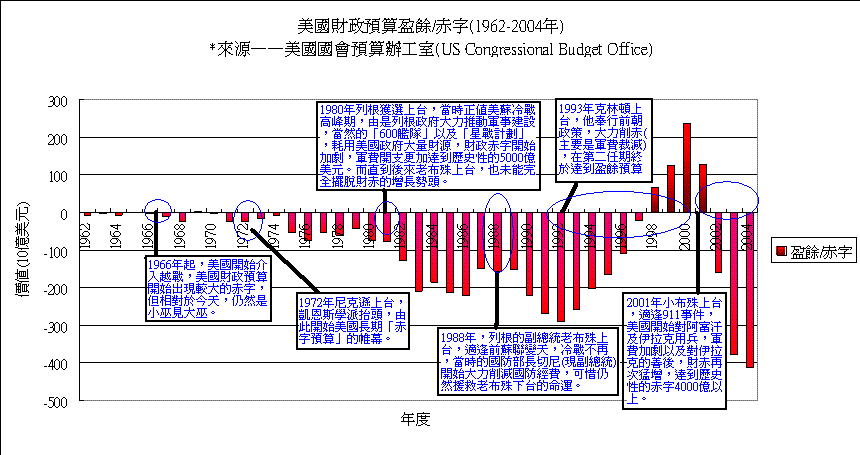 美國財赤發展.GIF
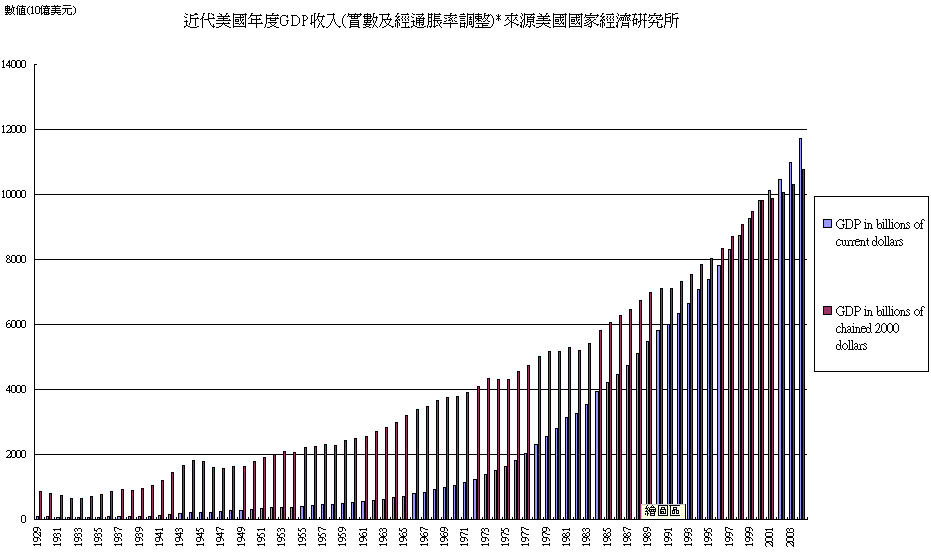 近代美國GDP數據.GIF
 美國近代GDP增長圖.GIF
 格林斯潘任內利息升跌.GIF
 美國財赤發展.GIF
 近代美國GDP數據.GIF
3楼
附錄2.1
本附錄引用自CNN網站英文原文,大家可以參考,如果能夠翻譯的,請在翻譯後傳上來,以造福後來者。
個人將會不日全面做這個翻譯,謝謝…
FR - Reuters Manufacturing PMI
How does this affect the market?
Published by CDAF/Reuters, the manufacturing survey is a composite indicator designed to provide an overall view of conditions in the manufacturing economy. It is based on monthly replies to questionnaires sent to purchasing executives in industrial companies.
法國——路透社製造業採購經理指數
由法國商業發展協會及路透社製作,這是一個對製造業的綜合調查指數,旨在提供一個對製造業經濟的基本展望,這個數字基於對各企業採購管理人員派發的問卷調查匯集而成,並每月公布一次。
EMU - Unemployment Rate
How does this affect the market?
The unemployment rate measures the number of unemployed as a percentage of the labor force.
歐盟——失業率
失業率是對就業總人數中的失業部份,以百份比顯示出來。
GB - CIPS Manufacturing PMI
How does this affect the market?
Published by the Chartered Institute of Purchasing & Supply (CIPS), the manufacturing survey is a composite indicator designed to provide an overall view of conditions in the manufacturing economy. It is based on monthly replies to questionnaires sent to purchasing executives in industrial companies.
英國——CIPS製造業採購經理指數
英國採購經理指數,是由英國特許採購及供應協會(CIPS) 制訂,這是一個對製造業的綜合調查指數,旨在提供一個對製造業經濟的基本展望,這個數字基於對各企業採購管理人員派發的問卷調查匯集而成,並每月公布一次。
US - Consumer Sentiment
How does this affect the market?
A survey of consumer attitudes concerning both the present situation as well as expectations regarding economic conditions conducted by the University of Michigan. Five hundred consumers are surveyed each month. A preliminary survey is usually reported about the second Friday of the month while a more complete survey is reported two weeks later. The level of consumer sentiment is directly related to the strength of consumer spending.
The pattern in consumer attitudes and spending is often the foremost influence on stock and bond markets. For stocks, strong economic growth translates to healthy corporate profits and higher stock prices. For bonds, the focus is whether economic growth goes overboard and leads to inflation. Ideally, the economy walks that fine line between strong growth and excessive (inflationary) growth. This balance was achieved through much of the nineties. For this reason alone, investors in the stock and bond markets enjoyed huge gains during the bull market of the 1990s. Consumer sentiment did shift down in tandem with the equity market between 2000 and 2002. Consumer spending
p.2
accounts for more than two-thirds of the economy, so the markets are always dying to know what consumers are up to and how they might behave in the near future. The more confident consumers are about the economy and their own personal finances, the more likely they are to spend. With this in mind, it's easy to see how this index of consumer attitudes gives insight to the direction of the economy. Just note that changes in consumer sentiment and retail sales don't move in tandem month by month.
美國——消費者情緒
這是由美國麥葛根大學主持的一個大型調查,旨在調查消費者面對當前或未來經濟發展的因素而表現出的消費意向。
每次數據調查都以500人為基數,並在每月的第二個周五作出速報數字的公布,然後再隔兩周公布最終的結果;這一個調查結果,跟消費者的消費強度,有非常直接的關係——即是說,消費者情緒越高,當月消費部份的經濟表理通常都會較強勁。
US - Construction Spending
How does this affect the market?
The dollar value of new construction activity on residential, nonresidential, and public projects. Data are available in nominal and real (inflation-adjusted) dollars.
Construction spending has a direct bearing on stocks, bonds and commodities because it is a part of the economy that is affected by interest rates, business cash flow and even federal fiscal policy. In a more specific sense, trends in the construction data carry valuable clues for the stocks of home builders and large-scale construction contractors. Commodity prices such as lumber are also very sensitive to housing industry trends. Businesses only put money into the construction of new factories or offices when they are confident that demand is strong enough to justify the expansion. The same goes for individuals making the investment in a home. A portion of construction spending is related to government projects such as education buildings as well a highways and streets. Why investors are more concerned with private construction spending, the government projects put money in the hands of laborers who then have more money to spend on goods and services. That's why construction spending is a good indicator of the economy's momentum.
US - ISM Mfg Index
How does this affect the market?
The Institute for Supply Management surveys nearly 400 manufacturing firms on employment, production, new orders, supplier deliveries, and inventories. A composite diffusion index of national manufacturing conditions is constructed, where reading above (below) 50 percent indicate an expanding (contracting) factory sector. Export orders, import orders, backlog orders and prices paid for raw and unfinished materials are also measured, but these are not included in the overall index.
p.3
Investors need to keep their fingers on the pulse of the economy because it dictates how various types of investments will perform. By tracking economic data like the ISM manufacturing index, investors will know what the economic backdrop is for the various markets. The stock market likes to see healthy economic growth because that translates to higher corporate profits. The bond market prefers less rapid growth and is extremely sensitive to whether the economy is growing too quickly and causing potential inflationary pressures. The ISM manufacturing data gives a detailed look at the manufacturing sector, how busy it is and where things are headed. Since the manufacturing sector is a major source of cyclical variability in the economy, this report has a big influence on the markets. More than one of the ISM sub-indexes provides insight on commodity prices and clues regarding the potential for developing inflation. The Federal Reserve keeps a close watch on this report that helps it to determine the direction of interest rates when inflation signals are flashing in these data. As a result, the bond market is highly sensitive to this report.
US - Motor Vehicle Sales
How does this affect the market?
Individual automakers (including foreign & domestic makes) report unit sales of domestically-produced cars and light duty trucks (including sport utility vehicles and mini-vans). Motor vehicle sales are good indicators of trends in consumer spending.
Since motor vehicle sales are an important element of consumer spending, market players watch this closely to get a handle on the direction of the economy. The pattern of consumption spending is one of the foremost influences on stock and bond markets. Strong economic growth translates to healthy corporate profits and higher stock prices. The bond market focus is on whether economic growth goes overboard and leads to inflation. Ideally, the economy walks that fine line between strong growth and excessive (inflationary) growth. This balance was achieved through much of the nineties. For this reason alone, investors in the stock and bond markets enjoyed huge gains during the bull market of the 1990s. Retail sales growth did slow down in tandem with the equity market in 2000 and 2001, although motor vehicle sales moderated to a lesser extent. A low interest rate environment environment through 2004 curtailed the decline in motor vehicle sales. In a more specific sense, auto and truck sales show market conditions for auto makers and the slew of auto-related companies. These figures can influence particular stock
p.4
prices and provide insight to investment opportunities in this industry. Given that most consumers borrow money to buy cars or trucks, sales also reflect confidence in current and future economic conditions.
GB - CIPS Services PMI
How does this affect the market?
Published by the Chartered Institute of Purchasing & Supply (CIPS), the service industry survey is a composite indicator designed to provide an overall view of conditions in the service economy. It is based on monthly replies to questionnaires sent to purchasing executives in service industry companies.
EMU - Retail Sales
How does this affect the market?
Retail sales measure the total receipts at stores that sell durable and nondurable goods.
US - Factory Orders
How does this affect the market?
Factory orders represent the dollar level of new orders for both durable and nondurable goods. This report gives more complete information than the advance durable goods report which is released one or two weeks earlier in the month.
Investors want to keep their fingers on the pulse of the economy because it usually dictates how various types of investments will perform. The stock market likes to see healthy economic growth because that translates to higher corporate profits. The bond market prefers more moderate growth which is less likely to cause inflationary pressures. By tracking economic data like factory orders, investors will know what the economic backdrop is for these markets and their portfolios. The orders data show how busy factories will be in coming months as manufacturers work to fill those orders. This report provides insight to the demand for not only hard goods such as refrigerators and cars, but nondurables such as cigarettes and apparel. In addition to new orders, analysts monitor unfilled orders, an indicator of the backlog in production. Shipments reveal current sales. Inventories give a handle on the strength of current and future production. All in all, this report tells investors what to expect from the manufacturing sector, a major component of the economy and therefore a major influence on their investments.
p.5
GB - Industrial Production
How does this affect the market?
Industrial production measures the physical output of the nation's factories, mines and utilities.
DE - Manufacturers' Orders
How does this affect the market?
Manufacturers' orders measure new orders placed for manufactured goods, both domestic and foreign.
US - MBA Purchase Applications
How does this affect the market?
The Mortgage Bankers' Association compiles various mortgage loan indexes. The purchase applications index measures applications at mortgage lenders. This is a leading indicator for single-family home sales and housing construction.
This provides a gauge of not only the demand for housing, but economic momentum. People have to be feeling pretty comfortable and confident in their own financial position to buy a house. Furthermore, this narrow piece of data has a powerful multiplier effect through the economy, and therefore across the markets and your investments. By tracking economic data such as the Mortgage Bankers Association purchase applications, investors can gain specific investment ideas as well as broad guidance for managing a portfolio. Each time the construction of a new home begins, it translates to more construction jobs, and income which will be pumped back into the economy. Once a home is sold, it generates revenues for the home builder and the realtor. It brings a myriad of consumption opportunities for the buyer. Refrigerators, washers, dryers and furniture are just a few items new home buyers might purchase. The economic "ripple effect" can be substantial especially when you think a hundred thousand new households around the country are doing this every month. Since the economic backdrop is the most pervasive influence on financial markets, housing construction has a direct bearing on stocks, bonds and commodities. In a more specific sense, trends in the MBA purchase applications index carries valuable clues for the stocks of home builders, mortgage lenders and home furnishings companies.
4楼
附錄2.2
US - ICSC-UBS Store Sales
How does this affect the market?
This weekly measure of comparable store sales at major retail chains is related to the general merchandise portion of retail sales. It accounts for roughly 10 percent of total retail sales.
Consumer spending accounts for more than two-thirds of the economy, so if you know what consumers are up to, you'll have a pretty good handle on where the economy is headed. Needless to say, that's a big advantage for investors. The pattern in consumer spending is often the foremost influence on stock and bond markets. For stocks, strong economic growth translates to healthy corporate profits and higher stock prices. For bonds, the focus is whether economic growth goes overboard and leads to inflation. Ideally, the economy walks that fine line between strong growth and excessive (inflationary) growth. This balance was achieved through much of the nineties. For this reason alone, investors in the stock and bond markets enjoyed huge gains during the bull market of the 1990s. Spending at major retail chains did slow down in tandem with the equity market in 2000 and 2001 and again in 2003. The ICSC-UBS index is one of the most timely indicators of consumer spending, since it is reported every week. It gets extra attention around the holiday season when retailers make most of their profits
US – Redbook
How does this affect the market?
The Redbook survey is a weekly measure of sales at chain stores, discounters, and department stores. It is a less consistent indicator of retail sales than the ICSC-UBS index. This index is correlated with the general merchandise portion of retail sales, covering only about 10 percent of total retail sales.
Consumer spending accounts for more than two-thirds of the economy, so if you know what consumers are up to, you'll have a pretty good handle on where the economy is headed. Needless to say, that's a big advantage for investors. The pattern in consumer spending is often the foremost influence on stock and bond markets. For stocks, strong economic growth translates to healthy corporate profits and higher stock prices. For bonds, the focus is whether economic growth goes overboard and leads to inflation. Ideally, the economy walks that fine line between strong growth and excessive (inflationary) growth. This balance was achieved through much of the nineties. For this reason alone, investors in the stock and bond markets enjoyed huge
p.7
gains during the bull market of the 1990s. Spending at major retail chains did slow down in tandem with the equity market in 2000 and 2001 and again in 2003. The Redbook is one of the most timely indicators of consumer spending, since it is reported every week. It gets extra attention around the holiday season when retailers make most of their profits.
US - Challenger Job-Cut Report
How does this affect the market?
A monthly report on the number of announced corporate layoffs. It is not adjusted for seasonal variations. The report indicates trends in the labor market.
These statistics on layoffs help us gauge the strength of the job market. Fewer layoffs suggests more people have jobs. Every job comes with an income, which gives a household spending power. Spending greases the wheels of the economy and keeps it growing, so the stronger the job market, the healthier the economy. There's a downside to it, though, which is relevant these days. When few people are looking for jobs, businesses can have a tough time finding new workers. They might have to pay overtime to current staff, use higher wages to lure people from other jobs, and in general spend more on labor costs because of a shortage of workers. This leads to wage inflation, which is bad news for the stock and bond markets. Federal Reserve chairman Alan Greenspan talks about it all the time and watches for it constantly. The Challenger report breaks down the layoffs into industries, which provides insight to trends that likely will effect stock prices in specific industries. Note that not all _announced_ layoffs culminate in _actual_ layoffs.
US - ISM Non-Mfg Index
How does this affect the market?
The non-manufacturing ISM surveys nearly 400 firms from 60 sectors across the United States, including agriculture, mining, construction, transportation, communications, wholesale trade and retail trade. Financial market players monitor the business activity index, because a composite index, like its manufacturing cousin, is not compiled by the ISM.
Investors need to keep their fingers on the pulse of the economy because it dictates how various types of investments will perform. By tracking economic data like the ISM non-manufacturing survey's business activity index, investors will know what the economic backdrop is for the various markets. The stock
p.8
market likes to see healthy economic growth because that translates to higher corporate profits. The bond market prefers less rapid growth and is extremely sensitive to whether the economy is growing too quickly-and causing potential inflationary pressures. The ISM manufacturing index has a long history - dating to the 1940s. This new report (beginning in 1998) was originally not adjusted for seasonal variation, but the ISM has since established seasonally adjusted figures for several of the ISM non-manufacturing components (including the business activity index) since 2002. As a result, the ISM non-manufacturing survey has garnered more attention and is almost as widely followed by financial market participants as its manufacturing cousin.
AU – Employment
How does this affect the market?
Nonfarm payroll employment counts the number of paid employees working part-time or full-time in the nation's business and government establishments. *Release time listed is for U.S. Eastern Time of the previous day.
AU - Unemployment Rate
How does this affect the market?
The unemployment rate measures the number of unemployed as a percentage of the labor force. *Release time listed is for U.S. Eastern Time of the previous day.
US - Monster Employment Index
How does this affect the market?
Monster collects job postings from 1,500 web sites (including Monster.com) and creates an index of job availability, akin to The Conference Board's help wanted index. The difference between the two is that one collects help wanted advertising from newspapers and the other collects from online posting. The Monster index is not seasonally adjusted.
In addition to providing insight on the general strength of the economy, this report gives a sense of how many jobs employers are trying to fill. If that number is relatively high, it could mean there is a shortage of available workers and companies may have to offer higher wages to attract them. This leads to wage inflation, which is bad news for the stock and bond markets. Federal Reserve officials are always worried about the potential for inflationary pressures. When the employment index measuring job availability is falling,
p.9
this bodes well for the bond market because it implies a drop in labor demand and perhaps an economic downturn. While the Fed worries about inflation, they also are concerned about rising unemployment. A rising jobless rate can mean a more accommodative monetary policy. The equity market prefers to see healthy economic growth and thus would rather see increases in the employment index. An increase in job demand means that consumers will have more money to spend on goods and services - and this ultimately affects profits.
GB - BOE Announcement
How does this affect the market?
The Bank of England Monetary Policy Committee consists of nine members. The Committee meets monthly, usually the first week in the month in order to determine the near-term direction of monetary policy. Changes in monetary policy are announced immediately after the meetings, but no details are available until the minutes are published two weeks later.
The Bank of England determines interest rate policy at their monetary policy meetings. The MPC is composed of the Governor, two Deputy Governors, two Bank Executive Directors, and four experts appointed by the Chancellor of the Exchequer. The MPC meets monthly (usually the first Wednesday and Thursday of the month) to determine interest rate policy. Unlike the Federal Reserve, Bank of Japan, or the European Central Bank, the Bank of England has an established fixed inflation target of 2.5 percent. Because interest rate decisions affect market interest rates, to varying degrees, the Bank's measure of inflation is the retail price index less mortgage interest payments (RPIX). As in the United States, market participants speculate about the possibility of an interest rate change at these meetings. If the outcome is different from expectations, the impact on British markets -- and to some extent in Europe -- can be dramatic and far-reaching. The interest rate set by the Bank of England, serves as a benchmark for all other rates. A change in the rate translates directly through to all other interest rates from gilts (fixed interest government securities named after the paper on which they were once printed) to mortgage loans. The level of interest rates affects the economy. Higher interest rates tend to slow economic activity; lower interest rates stimulate economic activity. Either way, interest rates influence the sales environment. In the consumer sector, few homes or cars will be purchased when interest rates rise.
p.10
Furthermore, interest rate costs are a significant factor for many businesses, particularly for companies with high debt loads or who have to finance high inventory levels. This interest cost has a direct impact on corporate profits. The bottom line is that higher interest rates are bearish for the stock market, while lower interest rates are bullish.
EU - ECB Announcement
How does this affect the market?
The European Central Bank Governing Council consists of 16 members. The Committee meets twice a month. The first monthly meeting of the month is devoted to monetary policy. Changes in monetary policy are announced immediately after the meetings. A press conference is held about 45 minutes after the meeting ends. A statement is read concerning their action -- or lack of it -- followed by a question and answer period. Unlike other major central banks, the ECB does not publish meeting minutes or make voting records on monetary policy issues public.
The European Central Bank determines interest rate policy at their Governing Council meetings. The Council is composed of the six members of the Executive Council and 12 presidents of member central banks (Bank of France, Bundesbank, etc). The Governing Council meets twice monthly (usually the first and third Thursdays of the month). Monetary policy issues are generally discussed only at the first meeting of the month. The European Central Bank has an established inflation ceiling of 2 percent. The ECB's measure of inflation is the harmonized index of consumer prices (HICP). As in the United States, European market participants speculate about the possibility of an interest rate change at these meetings. If the outcome is different from expectations, the impact on European markets can be dramatic and far-reaching. The interest rates set by the ECB serves as a benchmark for all other rates in the eurozone. The level of interest rates affects the economy. Higher interest rates tend to slow economic activity; lower interest rates stimulate economic activity. Either way, interest rates influence the sales environment. In the consumer sector, few homes or cars will be purchased when interest rates rise. Furthermore, interest rate costs are a significant factor for many businesses, particularly for companies with high debt loads or who have to finance high inventory levels. This interest cost has a direct impact on corporate profits. The bottom line is that higher interest rates are bearish for the stock market, while lower interest rates are bullish.
p.11
US - Jobless Claims
How does this affect the market?
New unemployment claims are compiled weekly to show the number of individuals who filed for unemployment insurance for the first time. An increasing (decreasing) trend suggests a deteriorating (improving) labor market. The four-week moving average of new claims smoothes out weekly volatility.
Jobless claims are an easy way to gauge the strength of the job market. The fewer people filing for unemployment benefits, the more have jobs, and that tells investors a great deal about the economy. Nearly every job comes with an income that gives a household spending power. Spending greases the wheels of the economy and keeps it growing, so a stronger job market generates a healthier economy. There's a downside to it, though. Unemployment claims, and therefore the number of job seekers, can fall to such a low level that businesses have a tough time finding new workers. They might have to pay overtime wages to current staff, use higher wages to lure people from other jobs, and in general spend more on labor costs because of a shortage of workers. This leads to wage inflation, which is bad news for the stock and bond markets. Federal Reserve officials are always on the look out for inflationary pressures. By tracking the number of jobless claims, investors can gain a sense of how tight, or how loose, the job market is. If wage inflation threatens, it's a good bet that interest rates will rise, bond and stock prices will fall, and the only investors in a good mood will be the ones who tracked jobless claims and adjusted their portfolios to anticipate these events. Just remember, the lower the number of unemployment claims, the stronger the job market, and vice versa.
US - EIA Petroleum Status Report
How does this affect the market?
The Energy Information Administration (EIA) provides weekly information on petroleum inventories in the U.S., whether produced here or abroad. The level of inventories helps determine prices for petroleum products.
Petroleum product prices are determined by supply and demand - just like any other good and service. During periods of strong economic growth, one would expect demand to be robust. If inventories are low, this will lead to increases in crude oil prices - or price increases for a wide variety of petroleum products such as gasoline or heating oil. If inventories are high and rising in a period of
p.12
strong demand, prices may not need to increase at all, or as much. During a period of sluggish economic activity, demand for crude oil may not be as strong. If inventories are rising, this may push down oil prices. Crude oil is an important commodity in the global market. Prices fluctuate depending on supply and demand conditions in the world. Since oil is such an important part of the economy, it can also help determine the direction of inflation. In the U.S. consumer prices have moderated whenever oil prices have fallen, but have accelerated when oil prices have risen.
US - Chain Store Sales
How does this affect the market?
Monthly sales volumes from individual department, chain, discount, and apparel stores are usually reported on the first Thursday of each month. Chain store sales correspond with roughly 10 percent of retail sales. Chain store sales are an indicator of retail sales and consumer spending trends.
Consumer spending accounts for more than two-thirds of the economy, so if you know what consumers are up to, you'll have a pretty good handle on where the economy is headed. Needless to say, that's a big advantage for investors. The pattern in consumer spending is often the foremost influence on stock and bond markets. For stocks, strong economic growth translates to healthy corporate profits and higher stock prices. For bonds, the focus is whether economic growth goes overboard and leads to inflation. Ideally, the economy walks that fine line between strong growth and excessive (inflationary) growth. This balance was achieved through much of the nineties. For this reason alone, investors in the stock and bond markets enjoyed huge gains during the bull market of the 1990s. Spending at major retail chains did slow down in tandem with the equity market in 2000 and 2001 and again in 2003. Chain store sales not only give you a sense of the big picture, but also the trends among individual retailers and different store categories. Perhaps the discount chains such as Target and Wal-Mart are doing well, but the high-end department stores such as Tiffany's are lagging. Maybe apparel specialty retailers are showing exceptional growth. These trends from the monthly chain store data can help you spot specific investment opportunities, without having to wait for the quarterly or annual reports. Just a few words of caution. Sales are reported as a change from the same month, a year ago. It is important to know how strong sales actually were a year ago to make sense of this year's sales. In addition, sales are usually reported for "comparable stores"
p.13
in case of company mergers.
5楼
附錄2.3
US - Treasury STRIPS
How does this affect the market?
A report on the amount of net stripping of Treasury securities that has taken place during the month. The report details gross stripping and reconstitution of Treasury notes and bonds by individual issue.
STRIPS is an acronym for Separate Trading of Registered Interest and Principal of Securities. A normal Treasury note or bond consists of a principal payment and semiannual interest payments. For example, a 30-year Treasury bond for $1,000 consists of 60 interest payments--one every six months for 30 years--and a principal payment of $1,000 when the bond matures. If this bond gets stripped of its interest (coupon) payments, it becomes a "zero-coupon" bond. The owner doesn't get paid any interest but buys the right to repayment of principal, $1,000, at a deep discount to the face value. Investors buy these to guarantee a certain payment amount at a specific point in the future (e.g. when a child will be ready for college), but don't want income from the bonds over that period.
US - Money Supply
How does this affect the market?
The monetary aggregates are alternative measures of the money supply by degree of liquidity. Changes in the monetary aggregates indicate the thrust of monetary policy as well as the outlook for economic activity and inflationary pressures.
To be honest, the various money supply measures don't matter to most investors these days. The monetary aggregates (known individually as M1, M2, and M3) used to be all the rage a few years back because the data revealed the Fed's (tight or loose) hold on credit conditions in the economy. The Fed issues target ranges for money supply growth. In the past, if actual growth moved outside those ranges it often was a prelude to an interest rate move from the Fed. Today, monetary policy is understood more clearly by the level of the federal funds rate. Money supply fell out of vogue in the nineties, due to a variety of changes in the financial system and the way the Federal Reserve conducts monetary policy. The Fed is working on some new measures of money supply, and given the way economic indicators ebb and flow in
p.14
popularity, don't be surprised if the monetary aggregates make a comeback in the future.
DE - Merchandise Trade
How does this affect the market?
Merchandise trade balance measures the difference between imports and exports of both tangible goods and services. The level of the international trade balance, as well as changes in exports and imports, indicate trends in foreign trade.
DE - Industrial Production
How does this affect the market?
Industrial production measures the physical output of the nation's factories, mines and utilities.
CA – Employment
How does this affect the market?
Nonfarm payroll employment counts the number of paid employees working part-time or full-time in the nation's business and government establishments.
CA - Unemployment Rate
How does this affect the market?
The unemployment rate measures the number of unemployed as a percentage of the labor force.
US - Employment Situation
How does this affect the market?
The Employment Situation is a set of labor market indicators. The unemployment rate measures the number of unemployed as a percentage of the labor force. Nonfarm payroll employment counts the number of paid employees working part-time or full-time in the nation's business and government establishments. The average workweek reflects the number of hours worked in the nonfarm sector. Average hourly earnings reveal the basic hourly rate for major industries as indicated in nonfarm payrolls.
If ever there was an economic report that can move the markets, this is it! The anticipation on Wall Street each month is palpable, the reactions are dramatic, and the information for investors is invaluable. By digging just a little deeper
p.15
than the headline unemployment rate, investors can take more strategic control of their portfolio and even take advantage of unique investment opportunities that often arise in the days surrounding this report. The employment data give the most comprehensive report on how many people are looking for jobs, how many have them, what they're getting paid and how many hours they are working. These numbers are the best way to gauge the current state and future direction of the economy. They also provide insight on wage trends, and wage inflation is high on the list of enemies for the Federal Reserve. Fed chairman Alan Greenspan talks about this data frequently and watches for inflation constantly. By tracking the jobs data, investors can sense the degree of tightness in the job market. If wage inflation threatens, it's a good bet that interest rates will rise, bond and stock prices will fall. No doubt that the only investors in a good mood will be the ones who watched the employment report and adjusted their portfolios to anticipate these events.
US - Wholesale Trade
How does this affect the market?
Wholesale trade measures the dollar value of sales made and inventories held by merchant wholesalers. It is a component of business sales and inventories.
Investors need to monitor the economy closely because it usually dictates how various types of investments will perform. The stock market likes to see healthy economic growth because that translates to higher corporate profits. The bond market prefers a slower rate of growth that won't lead to inflationary pressures. Wholesale sales and inventory data give investors a chance to look below the surface of the visible consumer economy. Activity at the wholesale level can be a precursor for consumer trends. In particular, by looking at the ratio of inventories to sales, investors can see how fast production will grow in coming months. For example, if inventory growth lags sales growth, then manufacturers will need to boost production lest product shortages occur. On the other hand, if unintended inventory accumulation occurs (i.e. sales did not meet expectations), then production will probably have to slow while those inventories are worked down. In this manner, the inventory data provide a valuable forward-looking tool for tracking the economy.
US - Consumer Credit
How does this affect the market?
The dollar value of consumer installment credit outstanding. Changes in
p.16
consumer credit indicate the state of consumer finances and portend future spending patterns.
Growth in consumer credit can hold positive or negative implications for the economy and markets. Economic activity is stimulated when consumers borrow within their means to buy cars and other major purchases. On the other hand, if consumers pile up too much debt relative to their income levels, they may have to stop spending on new goods and services just to pay off old debts. That could put a big dent in economic growth. The demand for credit also has a direct bearing on interest rates. If the demand to borrow money exceeds the supply of willing lenders, interest rates rise. If credit demand falls and many willing lenders are fighting for customers, they may offer lower interest rates to attract business. Financial market players focus less attention on this indicator because it is reported with a long lag relative to other consumer information. Long term investors who do pay attention to this report will have a greater understanding of consumer spending ability. This will give them a lead on investment alternatives.
FR - Industrial Production
How does this affect the market?
Industrial production measures the physical output of the nation's factories, mines and utilities.
GB – PPI
How does this affect the market?
The producer price index (PPI) is a measure of the average price level for a fixed basket of capital and consumer goods paid by producers.
GB - Merchandise Trade
How does this affect the market?
Merchandise trade balance measures the difference between imports and exports of both tangible goods and services. The level of the international trade balance, as well as changes in exports and imports, indicate trends in foreign trade.
JP - CGPI (PPI)
How does this affect the market?
The corporate goods price index (CGPI), previously called the wholesale price
p.17
index, is a measure of the average price level for a fixed basket of capital and consumer goods paid by producers. *Data published in the equivalent time of the release
FR - Merchandise Trade
How does this affect the market?
Merchandise trade balance measures the difference between imports and exports of both tangible goods and services. The level of the international trade balance, as well as changes in exports and imports, indicate trends in foreign trade.
GB – CPI
How does this affect the market?
The consumer price index is now the official inflation measure. It is defined as an average measure of change in the prices of goods and services bought for the purpose of consumption by the vast majority of households in the UK. It is calculated using HICP methodology. The CPI is the Bank of England's inflation measure.
CA - Bank of Canada Announcement
How does this affect the market?
The Bank of Canada Governing Council consists of 6 members. The Council makes an announcement about every six weeks to indicate the near-term direction of monetary policy. There is no meeting schedule as there is for the Federal Reserve, Bank of England and European Central Bank.
The Bank of Canada Governing Council determines interest rate policy for Canada. The Council is composed of the Governor, Senior Deputy Governor, and four Deputy Governors. There is no predetermined meeting schedule, but rather the Bank issues an announcement schedule at which time, monetary policy changes, if any, are made public. Unlike the Federal Reserve, Bank of Japan, or the European Central Bank, the Bank of Canada has an established inflation target range of between one and three percent but is focused on the mid-point of two percent. Because interest rate decisions affect market interest rates to varying degrees, the Bank has created its own core consumer price index, which eliminates eight volatile products. As in the United States, market participants speculate about the possibility of an interest rate changes. If the
p.18
outcome is different from expectations, the impact on Canadian markets can be dramatic and far-reaching. The interest rate set by the Bank of Canada, serves as a benchmark for all other rates. A change in the rate translates directly through to all other interest rates. The level of interest rates affects the economy. Higher interest rates tend to slow economic activity; lower interest rates stimulate economic activity. Either way, interest rates influence the sales environment. In the consumer sector, few homes or cars will be purchased when interest rates rise. Furthermore, interest rate costs are a significant factor for many businesses, particularly for companies with high debt loads or who have to finance high inventory levels. This interest cost has a direct impact on corporate profits. The bottom line is that higher interest rates are bearish for the stock market, while lower interest rates are bullish.
GB - Claimant Unemployment Rate
How does this affect the market?
This measure of unemployment is based on the International Labor Organization definition of unemployment, which excludes jobseekers that did any work during the month and covers those people who are looking for work and are available for work. The ILO unemployment rate is the number of people who are unemployed as a proportion of the resident economically active population of the area concerned.
GB - Average Earnings
How does this affect the market?
The index measures how earnings in the latest month compare with those for the last base year when the index took the value of 100. The current base year is 1995.
GB - ILO Unemployment Rate
How does this affect the market?
This measure of unemployment is based on the International Labor Organization unemployment, which excludes jobseekers that did any work during the month and covers those people who are looking for work and are available for work. The ILO unemployment rate is the number of people who are ILO unemployed as a proportion of the resident economically active population of the area concerned.
p.19
US - International Trade
How does this affect the market?
The international trade balance measures the difference between imports and exports of both tangible goods and services. Imports may act as a drag on domestic growth and they may also increase competitive pressures on domestic producers. Exports boost domestic production.
Changes in the level of imports and exports, along with the difference between the two (the trade balance) are a valuable gauge of economic trends here and abroad. Furthermore, the data can directly impact all the financial markets, but especially the foreign exchange value of the dollar. Imports indicate demand for foreign goods and services here in the U.S. Exports show the demand for U.S. goods in overseas countries. The dollar can be particularly sensitive to changes in the chronic trade deficit run by the United States, since this trade imbalance creates greater demand for foreign currencies. The bond market is also sensitive to the risk of importing inflation. This report gives a breakdown of U.S. trade with major countries as well, so it can be instructive for investors who are interested in diversifying globally. For example, a trend of accelerating exports to a particular country might signal economic strength and investment opportunities in that country.
US - Import and Export Prices
How does this affect the market?
Indexes are compiled for the prices of goods that are bought in the United States but produced abroad and the prices of goods sold abroad but produced domestically. These prices indicate inflationary trends in internationally traded products.
Changes in import and export prices are a valuable gauge of inflation here and abroad. Furthermore, the data can directly impact the financial markets such as bonds and the dollar. The bond market is especially sensitive to the risk of importing inflation because it erodes the value of the principal (the original investment) which is paid back when the bond matures. It also decreases the value of the steady stream of interest rate payments on this type of security. Inflation leads to higher interest rates and that's bad news for stocks, as well. By monitoring inflation gauges such as import prices, investors can keep an eye on this menace to their portfolios.
US - Treasury Budget
p.20
How does this affect the market?
The U.S. Treasury releases a monthly account of the surplus or deficit of the federal government. Changes in the budget balance of the annual fiscal year (which begins in October) are followed as an indicator of budgetary trends and the thrust of fiscal policy.
The budget data have several direct and indirect meanings for the financial markets. The most direct relationship lies between the size of the budget deficit and the supply of Treasury securities. The higher the deficit, the more Treasury notes and bonds the government must sell to finance its operation. From there it's simple supply and demand -- if demand is constant but the supply of bonds goes up, the price goes down. The same is true if the deficit falls or is eliminated altogether -- the government needs to sell fewer Treasury bonds, so the supply drops and the price of T-bonds rises. In the past few years, the budget deficit has increased dramatically, and this has put more Treasury securities into the market place. The Federal government borrows money through the issuance of Treasury securities; so higher deficits mean a larger supply of securities and (again, assuming constant demand) lower prices. With notes and bonds, lower prices are equated with higher yields, so in this example, the government borrows money at higher interest rates. That impact ripples across all other interest rate-bearing securities and creates a higher interest-rate environment for stocks, which is bearish. In addition to following the trend in the budget deficit or surplus, investors can gain valuable insight to the state of the economy by looking at the government's tax receipts. Higher tax receipts lead to an improved deficit situation when economic conditions are strong; conversely, lower tax receipts reflect a sluggish economic environment.
6楼
註:
US—美國
GB—英國
DE—德國
EMU—歐洲
JP—日本
FR—法國
AU—澳洲
[ 本帖最后由 leo 于 2005-8-8 21:43 编辑 ]
发表于:2005-08-08 10:59只看该作者
7楼
哈哈,是我的沙发啊,这么多,老师辛苦了。
学知识,赚大钱
损了不痛心 赚了要收手
发表于:2005-08-08 11:02只看该作者
8楼
板凳:$
发表于:2005-08-08 11:10只看该作者
9楼
顶
韬客社区www.talkfx.co
发表于:2005-08-08 11:50只看该作者
10楼
谢谢,辛苦了。。。
一边读孙子兵法,一边和汇市做买卖。
发表于:2005-08-08 13:18只看该作者
12楼
阅读有益
韬客社区www.talkfx.co
发表于:2005-08-08 13:51只看该作者
13楼
很有用,谢谢斑竹!!!
Money Maker
发表于:2005-08-08 14:00只看该作者
14楼
老师的帖, 真实强的不得了.
发表于:2005-08-08 14:01只看该作者
15楼
韬客社区www.talkfx.co
发表于:2005-08-08 14:02只看该作者
16楼
辛苦了
韬客社区www.talkfx.co
发表于:2005-08-08 14:18只看该作者
17楼
躺椅
听说你万事俱备,就差喊单了。
发表于:2005-08-08 14:54只看该作者
18楼
谢谢斑竹收藏了。
TO BE OR NOT TO BE
发表于:2005-08-08 15:03只看该作者
19楼
谢谢老师。
能把复杂的事情说成简单了就是真正理解的证明啊。
韬客社区www.talkfx.co
发表于:2005-08-08 15:19只看该作者
20楼
好帖,可惜我英文不好


