


[讨论]进来看看这个交易策略


本帖最后由 真的没有理由 于 2017-3-17 17:17 编辑
国外论坛看到的,可耐看不懂英语,请看懂的说说,这个策略具体是怎样使用的?
以下是策略原版:
Forex Trading with the MACD
ForexTrading with the MACDJune 26,2008 · Filed Under General, Guest Blogger Afterreceiving many requests, I’ve contacted the team from DayTradeology to help explain how touse MACD AND Forex. Please let me know what you think of the Guest Blog spot.=================================================================TheMACD (Moving Average Convergence Divergence) is a trend-following momentumindicator that shows the relationship between two moving averages of prices.The MACD is calculated by subtracting the 26-day exponential moving average(EMA) from the 12-day EMA. A nine-day EMA of the MACD, called the “signalline”, is then plotted on top of the MACD, functioning as a trigger for buy andsell signals when trading the forex market.FirstSome HistoryDevelopedby Gerald Appel,Moving Average Convergence/Divergence (MACD)is one of the simplest and most reliable indicators available.MACDuses moving averages, which are lagging indicators, to include sometrend-following characteristics.Theselagging indicators are turned into a momentum oscillator by subtracting thelonger moving average from the shorter moving average. The resulting plot formsa line that oscillates above and below zero, without any upper or lower limits.Benefitsof the MACDOneof the primary benefits of MACD is that it incorporates aspects of bothmomentum and trend in one indicator. As a trend-following indicator, it willnot be wrong for very long.Theuse of moving averages ensures that the indicator will eventually follow themovements of the underlying security. By using exponential moving averages, asopposed to simple moving averages, some of the lag has been taken out.MACDSetupThedefault settings for the MACD which we will use are:Slowmoving average - 26 days
Fast moving average - 12 days
Signal line - 9 day moving average of the difference between fast and slow.
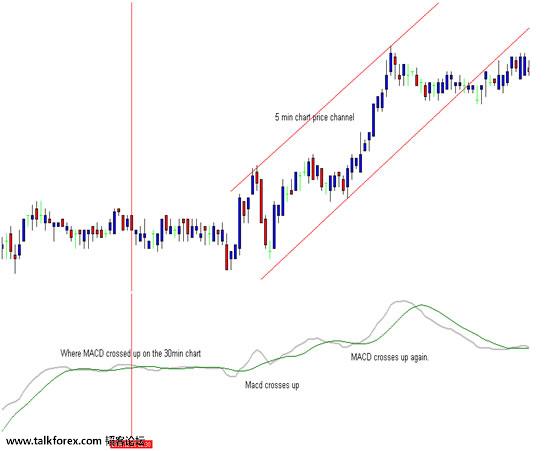
All moving averages are exponential.Althoughthere are three moving averages mentioned you will only see two lines. Thesimplest method of use is when the two lines cross. If the faster signal linecrosses above the MACD line ( The MACD line is calculated by the differencebetween the 26-day exponential moving average and the 12-day exponential movingaverage) then a buy signal is generated and vice versa.Thehigher above the zero both lines are the more overbought it becomes and thelower below the zero line both lines are the more oversold it becomes.Itmay also lead to a stronger signal if the signal line crosses down when it isoverbought and crosses up when it is oversold.Thelast common use of MACD is that of divergence.Ifthe MACD is making new lows and the price of the security is not making newlows that is one form of divergence (bullish divergence).Also,if the MACD has made a high and starts to head down but price continues up thatis another type of divergence (bearish divergence) and may lead to anindication of a change in direction.Thereare many ways to trade the MACD but one of our favourites are too use twodifferent time frames. All we do is establish a trend in a higher time periodthan the one we intend to trade. For our higher time frame welike to use the 30min chart and then drop down to the 5 min chart when conditions have been meton the 30 min chart.Onthe 30 min forex trading chart below there was a typical buy signal. The chartbelow (red arrow) shows the fast 9-day signal EMA (grey line) crossing over theMACD line EMA (green line).
After confirming the signal on the 30 min chart we then dropped to the5min chart and bought the rallies wherever the MACD crossed up, confident tostay long (to buy) as long as our higher time period MACD trend in the 30 minstayed intact. If the 30 min MACD signal line were to cross down we would haveclosed all long positions.
ConclusionTheMACD is not particularly good for identifying overbought and oversold levelseven though it is possible to identify levels that historically representoverbought and oversold levels. The MACD does not have any upper or lowerlimits to bind its movement and can continue to overextend beyond historicalextremes.Alsothe MACD calculates the absolute difference between two moving averages and notthe percentage difference. The MACD is calculated by subtracting one movingaverage from the other. As a security increases in price, the difference (bothpositive and negative) between the two moving averages is destined to grow.This makes its difficult to compare MACD levels over a long period of time,especially for stocks that have grown exponentially.Withsome charts you can set the MACD as a histogram. The histogram represents thedifference between MACD and its 9-day EMA. The histogram is positive when MACDis above its 9-day EMA and negative when MACD is below its 9-day EMA.Thathaving said, the MACD still is and will always be one of the few indicatorsthat all traders love and use daily and in many ways it is an old familiarfriend you know you can rely on.Thankyou for joining us in this forex trading lesson.
 2.jpg
2.jpg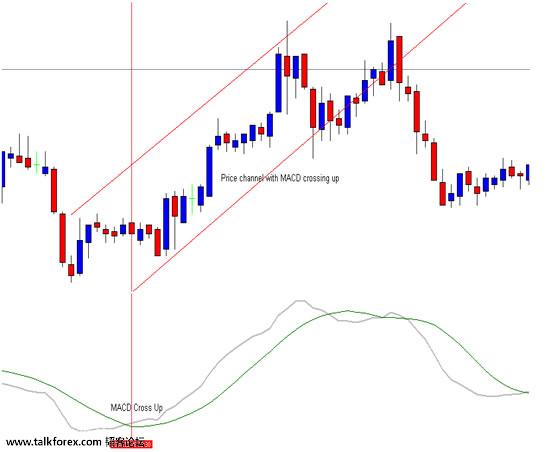 1.jpg
1.jpg
After confirming the signal on the 30 min chart we then dropped to the5min chart and bought the rallies wherever the MACD crossed up, confident tostay long (to buy) as long as our higher time period MACD trend in the 30 minstayed intact. If the 30 min MACD signal line were to cross down we would haveclosed all long positions.
ConclusionTheMACD is not particularly good for identifying overbought and oversold levelseven though it is possible to identify levels that historically representoverbought and oversold levels. The MACD does not have any upper or lowerlimits to bind its movement and can continue to overextend beyond historicalextremes.Alsothe MACD calculates the absolute difference between two moving averages and notthe percentage difference. The MACD is calculated by subtracting one movingaverage from the other. As a security increases in price, the difference (bothpositive and negative) between the two moving averages is destined to grow.This makes its difficult to compare MACD levels over a long period of time,especially for stocks that have grown exponentially.Withsome charts you can set the MACD as a histogram. The histogram represents thedifference between MACD and its 9-day EMA. The histogram is positive when MACDis above its 9-day EMA and negative when MACD is below its 9-day EMA.Thathaving said, the MACD still is and will always be one of the few indicatorsthat all traders love and use daily and in many ways it is an old familiarfriend you know you can rely on.Thankyou for joining us in this forex trading lesson.
2.jpg1.jpg

韬客社区www.talkfx.co


发表于:2017-03-17 14:40只看该作者
2楼

韬客社区www.talkfx.co


3楼
等我上英语培训班回来给你翻译

发表于:2017-03-17 16:36只看该作者
4楼
没什么特殊的。开始是讲什么是MACD, 然后以两线的交叉做为入场信号,看大做小(以两张图为例,看30分钟图,做5分钟图)。
韬客社区www.talkfx.co

5楼
老眼昏花 发表于 2017-3-18 00:36
没什么特殊的。开始是讲什么是MACD, 然后以两线的交叉做为入场信号,看大做小(以两张图为例,看30分钟图, ...
韬客社区www.talkfx.co

发表于:2017-03-18 13:08只看该作者
6楼
MACD + 趋势分析 is good !
韬客社区www.talkfx.co
7楼
阻击日线两端 发表于 2017-3-18 21:08
MACD + 趋势分析 is good !
韬客社区www.talkfx.co
发表于:2017-03-19 17:01只看该作者
8楼
本身就是中长期指标,几个参数也是通过电脑动态运算得到的值,体现在信号发生上,关于运用还要平时多观察,作者只是解释了咋用它,但这两张视图中的趋势线分析,很好的说明了它的效力,个人也认为macd要比其它指标给出的信号准确一些,虽然准,但要你长期观察学习,排除杂波,可以由趋势线分析去双双确认。
韬客社区www.talkfx.co

发表于:2017-03-19 22:30只看该作者
9楼
阻击日线两端 发表于 2017-3-20 01:01
本身就是中长期指标,几个参数也是通过电脑动态运算得到的值,体现在信号发生上,关于运用还要平时多观 ...
韬客社区www.talkfx.co