发表于:2016-04-27 21:13只看该作者
2楼
韬客社区www.talkfx.co
4楼
scalping 发表于 2016-4-28 05:13
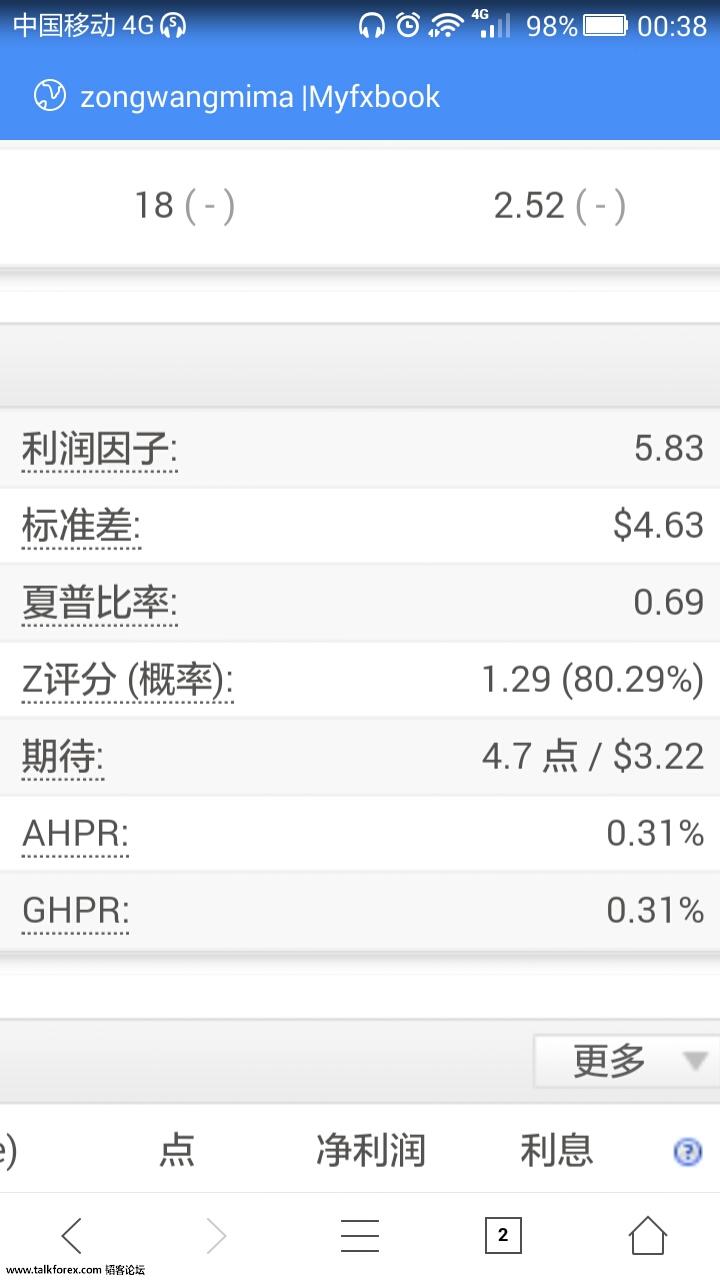
看见楼主的真名拼音了。 我说第一个吧,其他的留给后面的人。 利润因子就是我们常说的profit factor,对 ...
韬客社区www.talkfx.co
5楼
本帖最后由 总忘密码 于 2016-4-28 08:28 编辑
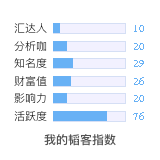
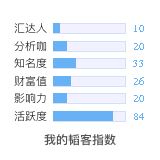
能讲得再详细点吗?而且4.7点现在变成了3.7点。$3.22变成了2.71。
yolailai 发表于 2016-4-28 08:15
主要看利润期待值。
点评
发表于 2016-04-28 03:21
韬客社区www.talkfx.co
6楼
scalping 发表于 2016-4-28 05:13
看见楼主的真名拼音了。 我说第一个吧,其他的留给后面的人。 利润因子就是我们常说的profit factor,对 ...
韬客社区www.talkfx.co
发表于:2016-04-28 01:35只看该作者
8楼
本帖最后由 scalping 于 2016-4-28 09:42 编辑
我看了一眼,很厉害!还以为忘总只做欧元呢,开始把短线技术用在了澳元英镑上了。
入场都很好。亏的也是因为入场后小赚不跑,错过了就扛,扛回来就OK了,时间实在太长抗不住的就止损。总而言之言而总之,能短能长,长短结合。
点评
发表于 2016-04-28 02:02
韬客社区www.talkfx.co
9楼
sweethome 发表于 2016-4-28 09:06
望总不用两点战法了?
韬客社区www.talkfx.co
10楼
scalping 发表于 2016-4-28 09:35
我看了一眼,很厉害!还以为忘总只做欧元呢,开始把短线技术用在了澳元英镑上了。 入场都很好。亏的也是因 ...
点评
发表于 2016-04-28 02:20
韬客社区www.talkfx.co
发表于:2016-04-28 02:16只看该作者
11楼
韬客社区www.talkfx.co
发表于:2016-04-28 02:20只看该作者
12楼
总忘密码 发表于 2016-4-28 10:02
涨跌出一定幅度才会在镑和澳上用,但对它俩还是心有余悸,因为点差大了自己没把握。你没看欧上最少0.05, ...
韬客社区www.talkfx.co
发表于:2016-04-28 02:23只看该作者
13楼
再附一些名词解释,经常遇到的。
Net Profit
Net Profit is a total profit/loss the strategy produced.
Drawdown, Max DD %
Drawdown is the measure of the decline from a historical peak in running cumulative profit of the strategy. Max DD % is the maximum percentage drawdown of the strategy.
Stagnation, % Stagnation
stagnation is a maximum number of days during which strategy stagnates - which means it doesn't make a new high on the equity. Obviously you'd want strategy with as little stagnation as possible.
% of Wins
percentage of winning trades
Annual % Return
average annual percentage return of the strategy. If it is 30 %, it means the strategy makes 30% every year in average.
Annual % Return / Max DD %
important ratio between annual percentage and maximum percentage drawdown. You'd want this number to be as high as possible.
Avg Daily, Monthly, Yearly profit
average profit for given period in $
Return/DD Ratio
a very good measure of strategy quality, the higher the number, the bigger are profits in relation to maximum drawdown.
Expectancy
performance metrics developed by Van Tharp, it is computed as (percentage wins * average win) - (percentage losses * average loss)
R-Expectancy
performance metrics developed by Van Tharp, it gives you the average profit value related to average risk (R) that you can expect from a system over many trades.
You can find more at: http://www.vantharp.com/tharp-concepts/expectancy.asp
R-Expectancy Score
standard R-Expectancy doesn't consider the length of testing period and number of trades produced. There is a difference is you'll make let's say $2000 per year by making 10 trades, or by making 100 trades.
R-Expectancy Score adds a score for trades frequency. It is computed as: R-Expectancy * averageTradesPerYear
SQN (System Quality Number)
performance metrics developed by Van Tharp, it is the measure of the quality of a trading system.
You can find more at: http://www.vantharp.com/tharp-concepts/sqn.asp
Standard interpretation of SQN is:
Score: 1.6 – 1.9 Below average, but trade-able
Score: 2.0 – 2.4 Average
Score: 2.5 – 2.9 Good
Score: 3.0 – 5.0 Excellent
Score: 5.1 – 6.9 Superb
Score: 7.0 - Keep this up, and you may have the Holy Grail.
SQN Score (System Quality Number Score)
just like in case of R-Expectancy, SQN doesn't consider the length of testing period and number of trades produced. In fact it is more favorable for systems that produce more trades, without considering the length of the testing period.
It is computed as: SQN * (averageTradesPerYear / 100)
Number of trades
simply a number of trades of this strategy in the backtest. You can use this criterion to approximate some preset value you would like to achieve (for example total 100 trades ). The value of this criterion will be bigger for strategies closer to the desired number of trades.
Stability
a special value in range from 0 (worst) to 1 (best) that measures how stable is growth of the equity chart.
You can see three sample strategies on the picture above. All of them finished with the same profit, but Strategy 1 was growing almost linearly (very stabile), Strategy 2 was growing with occasional big drawdowns (less stabile) and Strategy 3 was moving up and down (very little stability of growth).
Stability is a value that is quite good in representing a "quality" of the trading strategy and it can be used as the only one or the main criterion to compute the total strategy Fitness.
Symmetry
criterion to maximize strategy symmetry. Symmetry value is in %, and it is measuring how much is the Profit/Loss for Long direction similar to Short direction.
For example, if strategy makes $600 on Long trades, and $400 on Short trades, symmetry in this case is 66%. ($400 is 66% from $600).
If the strategy makes the same profit on both directions, the symmetry will be 100%. If one of the directions produces loss or 0 profit, the symmetry will be 0%.
Win/Loss Ratio
criterion to maximize the ratio of winning trades vs. losing ones
Average Win, Average Loss
criterion to maximize average win or minimize average loss per trade
Average Bars in Trade
criterion to minimize the average number of bars the trade is open
Average Bars Win, Average Bars Loss
criterion to minimize the average number of bars for the winning/losing trade
Degrees of Freedom
in a trading system relates to the number of criteria that are used to filter price action and/or volume and determine entry points.
The more criteria and variables used to determine entry timing points, the fewer degrees of freedom the system will have and vice versa.
Degrees of freedom are compute from strategy complexity and number of trades.
The simpler the strategy is, the more degrees of freedom it will have. For this property, the bigger value is better.
Complexity
measures the complexity of the strategy. It is simply a count of all the indicators, prices, operators and other building blocks that are used in the strategy. The higher this number is, the more “complicated” the strategy is.
For this property, the smaller value is better.
Both properties can be used also in the ranking to influence the Fitness function.
韬客社区www.talkfx.co
14楼
smile2u 发表于 2016-4-28 10:16
你点这个看,都写的很明白。 www】myfxbook】com/help#help_37
 还是要谢谢你
韬客社区www.talkfx.co
发表于:2016-04-28 02:54只看该作者
15楼
总忘密码 发表于 2016-4-28 10:37
看懂了个50%,因为都是翻译过来的中文。结合到我帐户所体现的数字上,还是不懂 还是要谢谢你
韬客社区www.talkfx.co
发表于:2016-04-28 03:21只看该作者
16楼
总忘密码 发表于 2016-4-28 08:27
能讲得再详细点吗?而且4.7点现在变成了3.7点。$3.22变成了2.71。
17楼
yolailai 发表于 2016-4-28 11:21
因为你的交易笔数太少了,所以受账面浮动影响较大。再积累一段时间就会获得相当稳定的数值了。
点评
发表于 2016-04-28 08:05
韬客社区www.talkfx.co
发表于:2016-04-28 08:05只看该作者
18楼
总忘密码 发表于 2016-4-28 16:03
看来这个数值也是越大越好,谢谢。
韬客社区www.talkfx.co


